Welcome to the fourth and last stop on the Vendor Survey learning line. At this skill station, you will experiment with the survey stream to see how data is collected and analyzed.
Learning Concepts at This Station:
Publishing the stream for testing
Modifying published details
Creating test records
Configuring checklist analysis
Creating the report
Analyzing the results
Earlier, you modified the stream to enable additional analysis of checklist fields. At this skill station, we will create a report and see what kind of analysis is performed.
Publishing the Stream for Testing
To run a report, the stream has to be published. So we start by publishing the stream, and making the launching form available to users.
Once published, it is no longer possible to create test records. So we need to make the launching form available for the moment, in order to create records. (Later, we'll see how to remove the form from the user's catalog, so the stream can only be launched programmatically, from the Vendor Onboarding process.)
- Go to the stream definition.
- Checkin the stream.
- Publish the stream.
- Form - Start Form
- Title - Vendor Survey Start Form
- Catalog Folder - All Processes
- Click Publish.
Modifying Published Details
Note that the details you entered a moment ago can be changed after the stream has been published. To experiment with that capability:
- From the stream Summary page, click the gear icon.
- Select Edit Published Information.
- Make a change:
- Description - This form is temporarily available for testing.
- Click Save Changes.
Creating Test Records
Start by creating two additional test records, so the stream has some data to crunch:
- Go to the home page.
- Click Submit New Form.
- Choose Vendor Survey Start Form.
- Use the same email you used earlier (the one that isn't associated with a Pulpstream user), but use a different vendor name.
- Fill out this one with a rating of "poor", and ask to be contacted.
- Repeat the process once again, with a third vendor name.
Viewing the stream records, you see three records -- two in progress and one complete.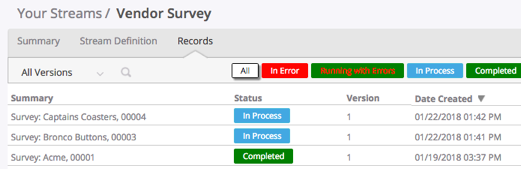
- Fill out the last survey with a rating of "good", and with no need to be contacted.
When you refresh the display, the listing shows two surveys complete and one still in progress (waiting for you to say you contacted the vendor).
Configuring Checklist Analysis
Recall that in the stream Summary tab, in the Settings options, we enabled checklist analysis. At the time, the start form configured in the stream process start-step was the Survey Form. That was the configuration we wanted because, to identify the checklist fields to analyze, Pulpstream uses the first form defined in the stream.
Limiting the number of forms makes sense, when you think about it. In a complex system with hundreds of fields, a lot of computing power would otherwise be wasted on analysis of fields no one cares about.
The issue, for us, is that we changed the start form in the stream definition to be the simple launching form, rather than the Survey Form that contains the real data. We will fix that problem now:
- Go to the stream definition.
- Double click the start-step to open it.
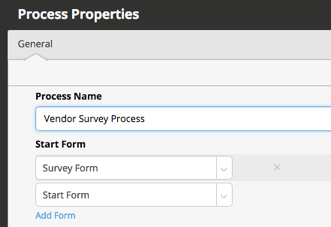
- At the bottom of the dialog, hover over the Start Form to reveal the "X" next to it.
- Click the "X" to delete the form (for the moment).
- At the bottom of the dialog, click Add Form.
- Choose the Survey Form.
- Click Add Form once again, and this time choose the Start Form.
- Click Save Changes.
You now have a list of two forms which can be used to launch the stream. Because the Survey Form is first, it will be used for checklist analysis. The Start Form, meanwhile, can still be used to launch the process.
Creating the Report
Now we're ready to create the report:
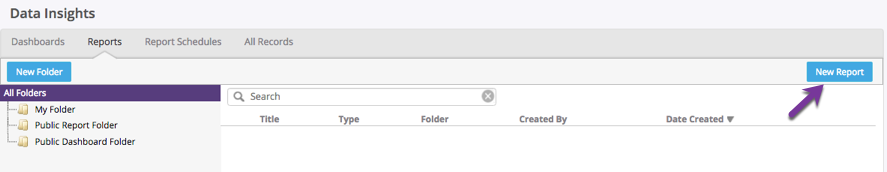
- At the top of the Pulpstream screen, click Data Insights.
The Data Insights window open. - Under the page heading, click the Reports tab.
- At the right side, click New Report.
- In the list of report types available for you to choose, several points are worth noting.
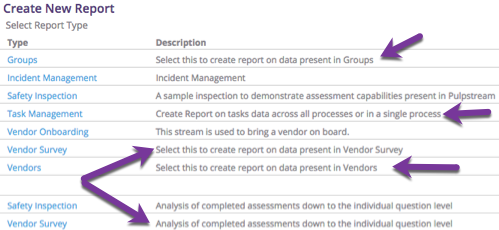
- At the top are default reports created for your Pulpstream account.
- Reports on user Groups and stream Tasks are created in every account.
- The Incident Management and Safety Inspection reports are created by default in the trial account, for people experimenting with the system.
- Below those comes report types created for streams (for example, the "Vendor Onboarding" report type) and report types created on Smart Objects ("Vendors").
- In particular, note that there are two kinds of "Vendor Survey" report types:
- The upper choice creates a report on data in the Vendor Survey stream.
- The one at the bottom (one of two after the blank line) are the analysis reports we are interested in here.
- Choose the entry at the bottom of the list.
The Report Wizard window opens.
Analyzing the Results
Notice that in the Filter Data section, you can select the records you want to process. To see the kind of report that is produced, click Run. The Report Preview section opens, showing you what the report looks like. (If you save it, you can give it a name and run it by selecting it from the reports list.)
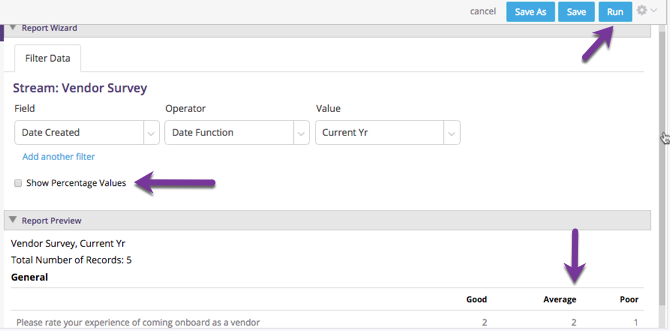
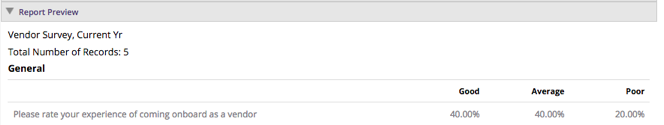
In this case, the stream contains five records, and the numbers are shown for each choice. But in the Report Wizard section, you can choose Show Percentage Values instead. If you then Run the report, the distribution is shown as a set of percentages for each choice.
Of course, it isn't usually the case that data you're crunching has only field of interest. But this kind of checklist-analysis report displays the same kind of results for every checklist field in the form.
In addition, you can drill down to get a better breakdown of the data. To see how that works, click on the data row. When you do, a dialog opens that lets you create subsidiary reports on that row of data. In those reports, you can add additional filters, and you can get results that are divided into groups.
For example, grouping on creation data can give you a sense of how satisfaction levels are changing over time. (Of course, when all the records are created the same day, as with our test records, that kind of analysis doesn't do much. But in real life, it's a handy tool to have. The important point is that in addition to the initial breakdown of the data, you can investigate further to find out what lies behind the results you're seeing.
For extra credit...
Experiment to see the effect of the stream configuration. To do that, go to the stream definition, and remove the Survey Form from the list of forms that can launch the process. Then come back here and run the report. (You'll see a count of records, with nothing else reported.)
Learn More
Grouping data in useful ways and running reports on it is a subject that has a lot of depth. For more on that subject, see the Inspection & Assessments tutorial, which goes into the matter in depth.
For more on record-filtering, see Filtering Criteria in the online help system.
Take the Next Step
Congratulations! You've made your first foray into the kind of comprehensive checklist analysis that Pulpstream makes possible.
At the next and last skill station, we will launch the stream, from the Vendor Onboarding process, so that one set of activities flows naturally into the next.