As inspectors and assessors are in the field, they are collecting a lot of data. Today, we are going to learn how to use Pulpstream to analyze that data.
Learning concepts:
Using data insights
Making streams available for analysis
Using the report wizard to make data filters
Running data analysis
Exporting data insights
Video Tutorial:
Let's start by exploring the options that are available on our Stream Summary page. Access your Streams Management area. Go to Your Streams.Click on the Summary tab. To the right of your stream versions Summary, click on the gear icon. In this pull-down menu you will see many options related to this stream.
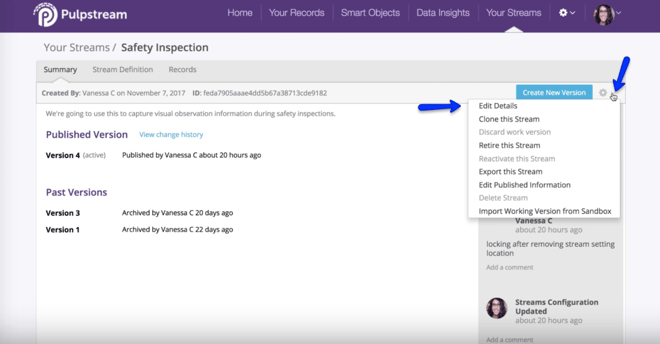
This is a summary of what options are present:
- Edit Details – You can change stream name and some other options.
- Clone Stream – You can create copy of this stream.
- Discard Work Version – This option is only enabled when you have a new work version and you no more want to use it.
- Retire this Stream –You no more want end users to be able to create new records. The stream will continue to be available for reports and all of the records will stay preserved. All records that are in process will continue to work without any issues.
- Reactivate this Stream – This option become available only when you are looking at a retired stream and you want to bring it back to life.
- Export this Stream – This will create a zip file of the definition of the stream, that you can backup or you can then import into another tenancy.
- Edit Published Information – This option gives you access to the published information such as Name of the form, description that end user sees as well as the Catalog folder in which the forms will appear.
- Delete Stream – This option becomes available only when you are looking at a retired stream and you want to entirely delete it. You will not be able to delete a stream that has one or more records associated with it
- Import Working version from Sandbox – If you have a sandbox account when you are doing development, you will be able to export from that account and import a new version here.
Right now, we are interested in the Edit Details option. Click on that. Let's explore the options on this Edit Stream Details popup. This option allows you to specify who can restart, abort, and delete the records created with this stream. Those are administrators, which would be specified in this field under the Administrator field title. You can search for users with this magnifying glass, or by typing their name into the field.
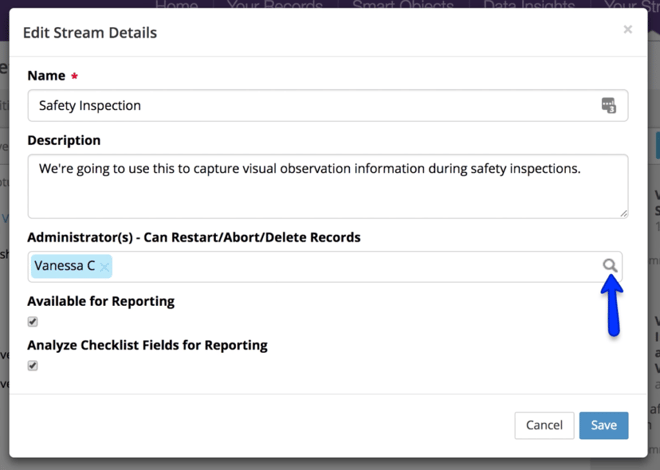
The Available for Reporting option is enabled by default. Checking this box tells the Pulpstream engine that we want this stream to be available for analysis. If you retire a stream, you should uncheck this box to prevent this stream’s data from being included in a report.
The Analyze Checklist Fields for Reporting option is for streams, like our Safety Inspection stream, that include checklist fields. It is specially designed for streams that that collect audit, assessment or inspection data. A dataset related to one of these stream types can have hundreds of observation requirements with answers such as yes, no, and not applicable. When this option is enabled, Pulpstream starts to analyze this type of data and present you with options to create reports using these data types. Lets check this box to turn the option on. It is important to note that enabling this option will not trigger retroactive data inclusion. It will only include new records.
To see our changes in action, we need records to analyze. Create and submit 2 new inspections. Create one with today’s date. Provide a variety of observations in the inspection. Create and submit a second inspection. Give that one an inspection date from a month ago and do the inspection at a different location. I will do this too, so we can review our records together.
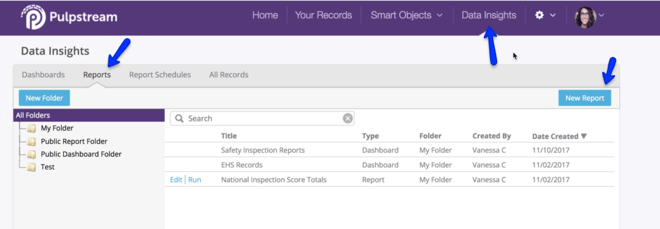
Now that we have two records to analyze, let's move on. Access Data Insights areathe main, purple navigation menu. Click on the Reports tab. Then click on the New Report button.
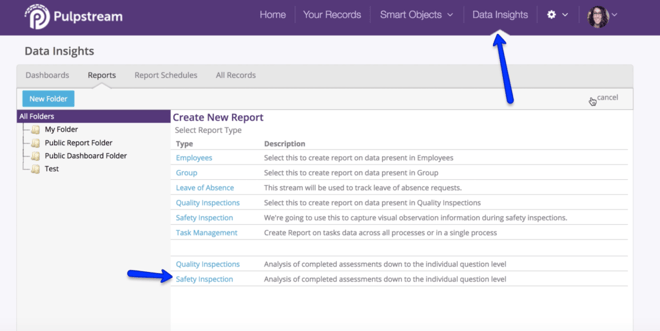
You will see a few types of Reports you can create here. You will need to select the data that you want to include in a report. We want to analyze Safety Inspections data, thus we will choose “Safety Inspections.”
The Report Wizard starts us on the Select Fields tab. Select the fields you want included in the report. You will need to create a report view and a folder to store it in.
Next, select fields to include in our report.
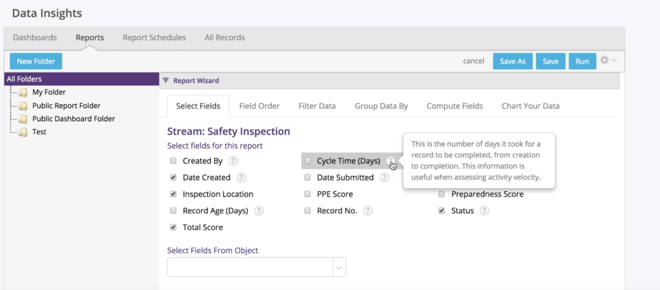
Choose Inspection Location, Date Created, Total Score, and Status. (If you need help understanding what each of these are, click on the question mark icon to learn more about each option.
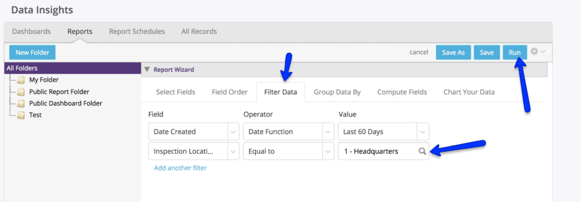
On the Filter Data tab, we will add analysis filters such. Add as many filters as you like by clicking on the “Add another filter” button under the fields. You can add filters for a specific month or location. We want to see data about those 2 records we created. I specified that I inspected our SF and Chicago locations. We will create 2 filters.
In the first fields pull down menu, I will select “Date Created.” The operator, will be a “Date Function,” The will be “ Current Year.” In the second Field, select “Inspection Location.” The operator will be “Equal to.” The value will be Headquarters. After setting those filters, click the Run button.

The data caught by that filter is now visible. You will see the 2 records you created with the fields you specified.. You can export or print this data by clicking on the gear icon on the far right side of the Report Wizard. In the pull-down menu, you would choose “Export.”
You could click on any observation to drill down into the details. You can see which location is complying by policies, and which locations are not in compliance. You can also export this drill down data by clicking on the gear icon in the upper right side of this popup screen.
That’s it. You have learned how to use Pulpstream to create reports with your inspection data. And with this, our voyage on the Inspections & Assessments Learning Line concludes.
Want to learn more ways to streamline ops processes? Subscribe to our YouTube channel, or simply go to the home page to explore other use cases.