Good internal communication is essential for maintaining a productive workforce. A business also needs efficient systems to streamline its processes. Fortunately, a workflow chart can help your company have both clear communication and functional systems.
It can be difficult for leadership to communicate a company’s goals and priorities and break them down into projects and processes employees can execute. A workflow chart allows you to express a process using visuals. Visual information enhances clarity and is easier to understand. It's said that the human brain retains visual information better than text, and tapping into that function can help your employees understand your systems or projects better than they will with a wall of text or a morning meeting.
Workflow charts are a functional visual communication approach to planning and sharing business processes, project outlines, and task updates with team members and stakeholders. This article discusses the details of workflow charts: what they are, common types and uses, and how to create them.
What Is a Workflow Chart?
A workflow chart is a visual representation tool that communicates information involved in a process workflow or project. These charts are also called workflow diagrams, process diagrams, or process flowcharts. Using symbols, colors, and arrows, they show an overview of a business process, illustrate how the different parts of a process connect, and guide the reader to follow outlined process steps to achieve the desired outcome.
Workflow charts help team members see how their tasks fit into the organization's big-picture goals. If a process step is overlooked or skipped, its impact on subsequent tasks is visible and traceable. Workflow charts illustrate processes using shapes and symbols like circles, diamonds, and arrows to represent different process steps. Each shape is assigned a purpose so that readers can navigate the workflow.
Some workflow charts represent one-time projects, while others are created by documenting a process to transform it into a template for future instances. Either way, the efficiency and clarity of a workflow chart helps all stakeholders understand their roles in a process or operation.
Uses of a Workflow Chart
Workflow charts come in handy in many cases. For example, when defining new work processes or improving existing ones, you can conceptualize the process visually and communicate it using a workflow chart. Depending on how detailed your workflow diagram is, you may be able to include other essential details, such as task owner, timeline or due date, and instructions to achieve the desired outcome.
Workflow diagrams are useful for business process mapping and transformation. Use them to map out existing work processes in different departments and reveal redundancies or inefficiencies. Managers can then develop process improvement plans to automate manual, repetitious work and create more time for employees to work on high-value tasks. Using workflow diagrams, teams can continuously optimize workflows and streamline business processes as needed.
There are many other uses of workflow diagrams: onboarding new employees, launching a new product, or designing a project that requires collaboration between multiple departments or separate companies. A workflow chart is also a highly customizable tool in the hands of managers across industries and company sizes. A workflow chart from a retail shop office manager would represent a completely different process than one from a global e-commerce company.
Types of Workflow Charts

There are several formats and styles of workflow charts to choose from. Depending on your needs, different types of workflow diagrams will best communicate your process. Here are some of the most common workflow charts.
Business Process Modeling Notation (BPMN) Diagrams
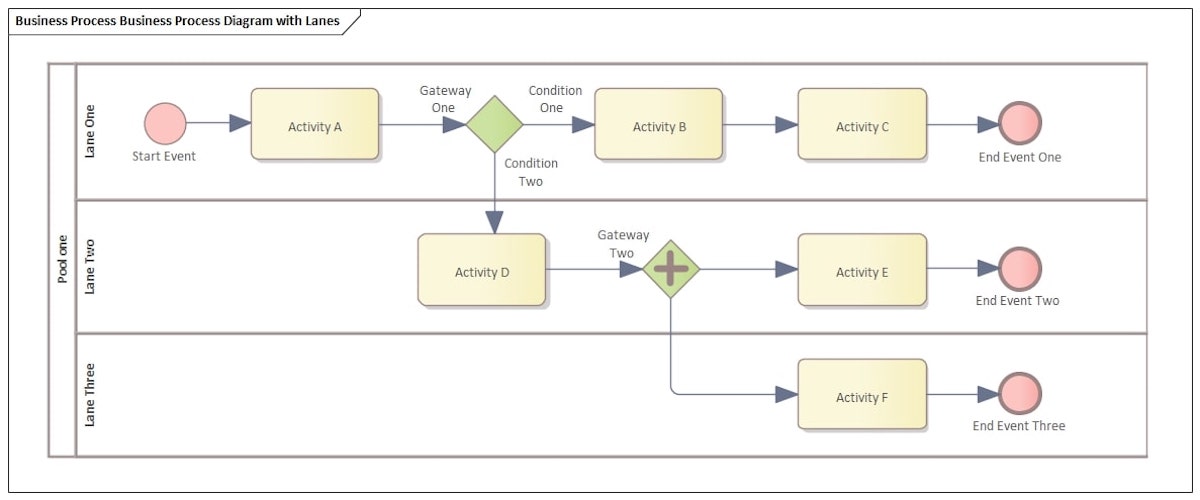
Image: Sparx Systems
A Business Process Modeling Notation (BPMN) diagram is a detailed version of a workflow chart that uses notations or standardized symbols to communicate the different steps in a process. BPMN flowcharts focus on illustrating how information and data flows within an organization. These workflow diagrams are often used for internal communications, like when trying to improve on an existing process or training new members of a department about the common workflows they will go through.
Process Flow Diagrams
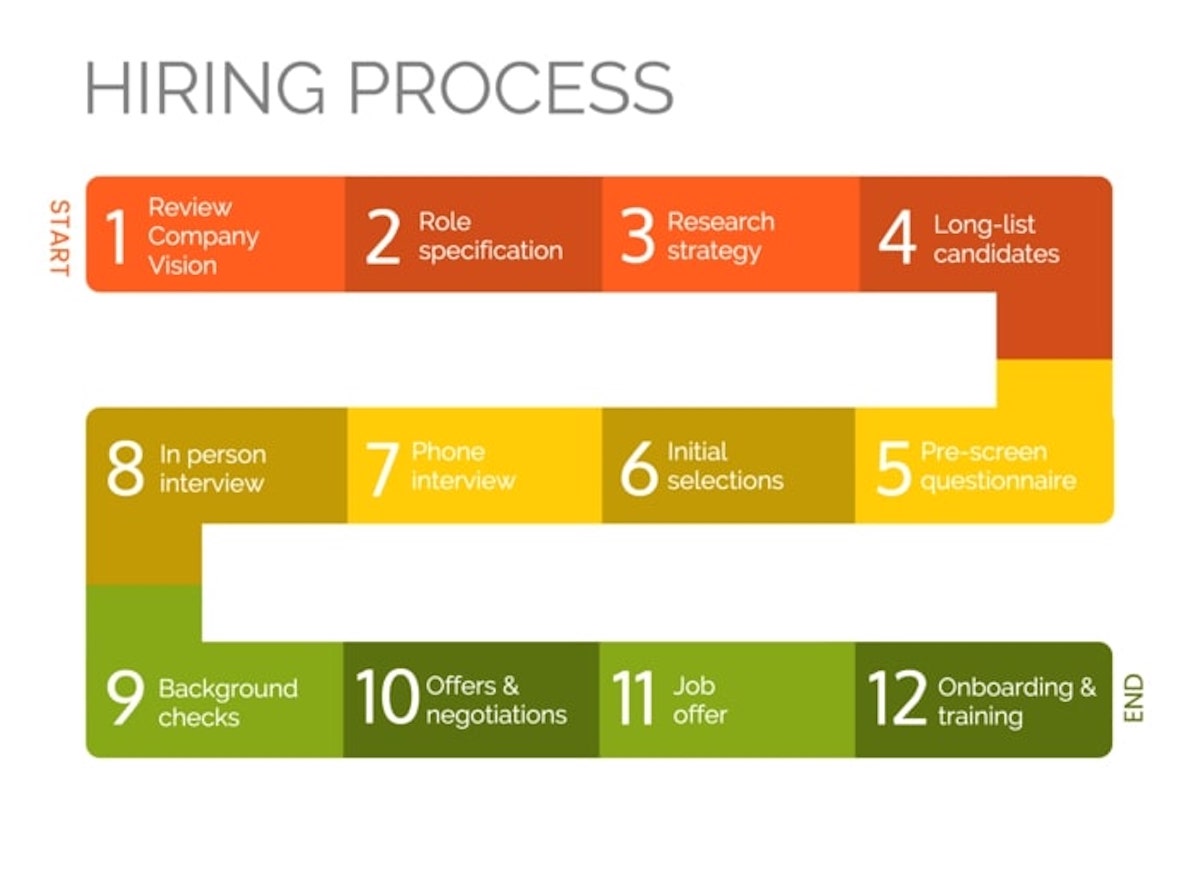
Image: Venngage
A process flow diagram is the most common type of workflow chart. It is also the most linear format, since the workflow diagram is organized chronologically. Process flow diagrams ensure team members are aligned on the direction and progress of a project. Everyone involved can see what stage of the process they are in and what comes next. This makes them effective for providing an outline of a workflow without too many steps or details. A process flow diagram is also a good fit for frequently repeated processes, like inquiry or invoicing.
Swimlane Diagrams

A swimlane diagram takes the process flowchart a step further. It breaks down a workflow into interconnected units like swim lanes in a pool. These different lanes add another layer of organization to the flowchart and make it easier to spot bottlenecks in a process. By illustrating who is responsible for what in a process, and how each stakeholder’s work impacts the other participants, these flowcharts go beyond the data flow diagrams mentioned above. With a swimlane diagram, everyone involved can have a clearer understanding of their role and how it contributes to the final result. This makes swimlane diagrams the ideal workflow chart for projects that require multiple departments to collaborate on one goal or product.
Creating Your Own Workflow Chart
You can be creative when workflow diagramming as long as you have clear principles for each shape or symbol in your diagram. Remember, the goal in creating a workflow diagram is to communicate the steps of a process in your business, not create a beautiful but incomprehensible image.
To make your workflow charts easy to understand and communicate your process steps clearly, ensure you highlight:
- The start and endpoint of the process
- Key decision points
- Tasks and action steps
- Other crucial instructions or guidelines
The shapes, colors, and symbols you use are up to you. Just be sure they are consistent across workflow charts in your organization — don’t use circles to illustrate your endpoints if your other diagrams have used diamonds for that purpose.
Once you are clear on your start and endpoints, action steps, and other key elements, follow our five-step plan below to create a workflow chart:
1. Conduct a Workflow Analysis
Before designing a workflow diagram, conduct a workflow analysis to uncover any weaknesses or deviations in the process you want to map out. Workflow analysis helps discover inefficiencies before you create a diagram that leads employees through the process. It can also reveal where streamlining or eliminating steps could make the workflow more efficient.
2. Define Your Goal
What do you want to achieve or improve by diagramming this process? Maybe you want to onboard new employees more efficiently, or smoothly transition to a new workflow as your team grows. Once you know what you want to come from creating this diagram, you’ll have a clearer vision of how your workflow chart can serve its purpose.
3. Get Input From Team Members
Talk to other involved stakeholders and team members to refine your goal. As you gather input and feedback from others, you gain a more rounded view of the process and what needs to be done. You learn how different team members operate and why dead ends or bottlenecks occur. Encourage openness and constructive contributions so you get the most out of this step.
4. Draw Your Workflow Chart
With your analysis, goals, and feedback from team members, you can begin designing your workflow chart. Organize key data points, timelines, responsible parties, and other important details in a layout that fits your needs. Be clear about the start and endpoints so users will know when they've successfully completed a process.
5. Continuously Improve Your Processes
Continue to gather data and feedback about the process. How much has understanding improved? Are your team members struggling at any stage? This data helps you refine your processes and increase your operational efficiency.
Create Better Business Processes With Pulpstream
Communicating with a reliable and easy-to-understand approach creates an effective work environment. Workflow charts are visual tools that can educate employees and collaborators on how a process or project will advance.
Pulpstream's workflow management solutions help take your ideas from concept to process maps and custom solutions built with no-code tools, reducing how long it takes to build new or optimize old business processes.
Are you ready to transform your organization with better business processes and templates to improve operational efficiency and reduce work time? Get started with a demo of Pulpstream today.
Pulpstream
- Process Automation
- Platform for HR & Risk Compliance
Explore Solutions
Related Blogs