Welcome to Skill Station 5. Now that we have learned how to trigger corrective actions and automated email reminders, how do we know if this has impacted performance? Furthermore, how do we know if one location or division is doing better than another? We turn to the data!
Today we’ll be learning how to add quantitative data to inspections for performance score calculation.
Learning concepts in this Skill Station:
Assigning scores to inspections
Calculating performance scores
Editing report templates to add scores to them
Introduction to the update fields smart step
Testing report templates
Video Tutorial:
Let's get started by accessing our Inspections work stream. Go to Streams Management. Click on the Inspections work stream. This will take you to your stream summary. Click on the version to unlock it. You should now see the Stream Definition canvas.
Assigning Scores to Inspections
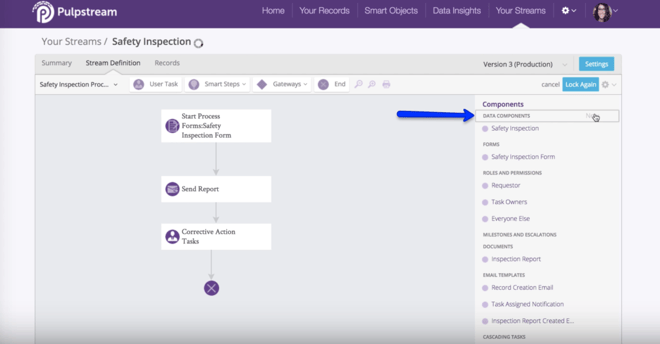
On the right side of the screen in your Components Catalog, you will see your Inspection data component. Hover your mouse pointer over that to reveal the edit feature.
In the Edit Data Component Window that pops up, click on the Fields tab. Select one of the questions that the inspector would have to answer while visually observing the area. Make note of the fact that the Pulpstream engine recognizes this checklist question with the name "ch1."
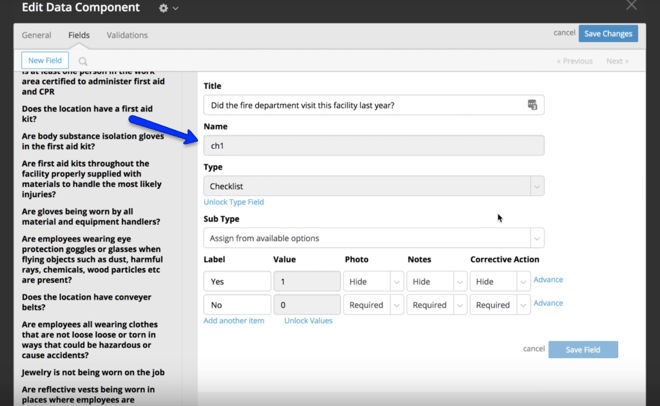
In the label, which is the answer to the question in the checklist, Yes has a value of one, while no has a value of zero. If one of the questions that your inspector had to answer was more important than the others, you would change the value that is assigned to each question here. You could give it any numerical score to suit your business needs.In our Inspection, we have a total of 11 questions that our inspector had to answer. Each was given a value of 1 or 0, which would make the maximum total score for this inspection an 11.
There were 2 sections in our inspection: Preparedness and PPE. We’re going to calculate each one separately and then calculate the total, final score.
Calculating Performance Scores
Let's add a new Data Component to store our scores. Go to your Stream Definition canvas. On the right side in your Components catalog, hover your mouse cursor over the Data Components section title to reveal the “new” function. Click on that to create a new Data Component.
While on the General Tab, name your New Data Component “Scores.”
On the Fields tab, click on the New Field button. Add 4 fields with these attributes: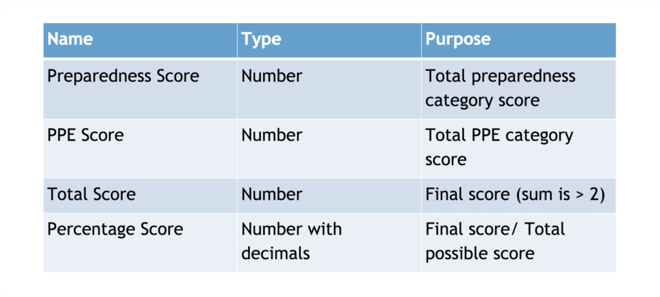
When you have done this, your new data component will look like this:
Save your fields; and save your changes.
You should now have 2 data components in your catalog. We will use this in a new step in our stream, so let's make room for it. Delete the connecting line between the Process Forms step and the Inspection step. (Click on it and tap your delete button.) Highlight all the steps below that one to select them. Drag them down to make room for the new Scoring step.
Introduction To the Update Fields Smart Step
In the navigation bar, click on Smart Steps to find the Update Field Step. Click on it and drag it down into the work Stream Definition canvas.
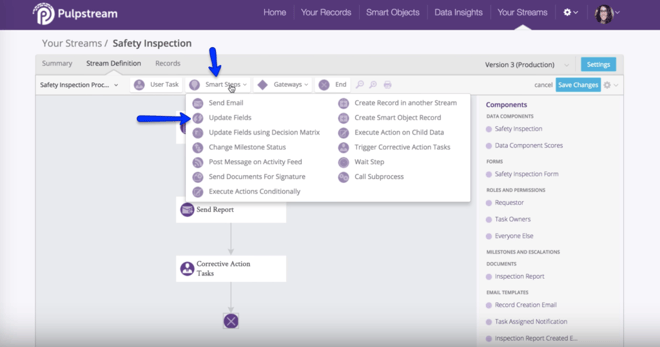
In the popup menu, title it “Calculate Score.”
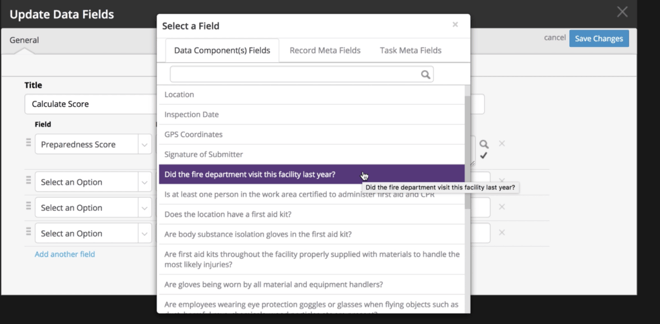
Let's calculate our Preparedness Score first. Select that in the Field pull-down menu. The Map Type will be an Expression. The expression field is where we will insert some basic math to calculate scores. We’re going to make an expression that sums up the values we assigned to the questions in our checklist. Click on the magnifying glass icon to search for the name that Pulpstream uses to identify the question in the checklist.
![]()
Select the question you want to score in the pull-down menu.
Copy the name, aka the merge field value, and paste it into the basic expression we’re creating.
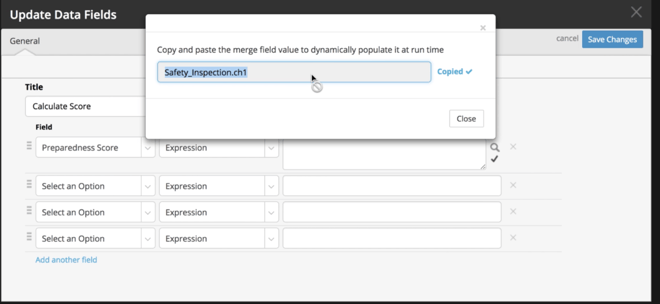
Add a plus sign after that merge field value to start creating an expression that will add all the values. Do this for all of the preparedness section questions until you have a basic string of merge field values. It should look like the one in this photo.
Test it, if you like, by clicking on the checkmark icon. The result will be on the bottom of the page that pops up.
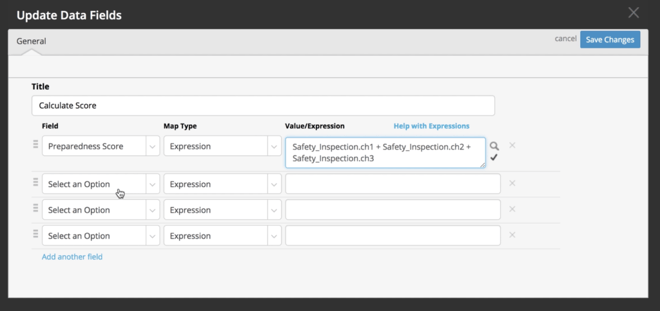
In the Update Field step, on the general tab we need to a dd another field for the PPE Score calculations. It will be the same map type . Again, we’re going to concatenate the values for the responses to each question to create an expression that calculates the scores. Again, click on that magnifying glass icon to search for and select the questions we want to score. Copy and paste the merge field values into the value/expression field.
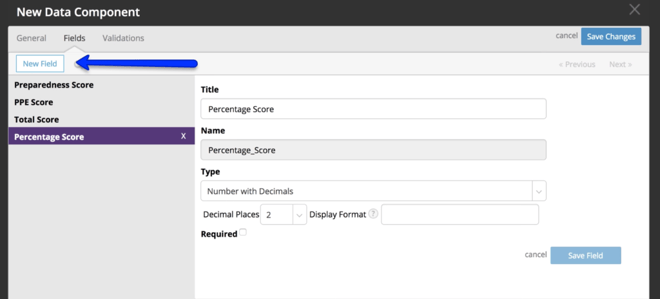
Next, add 2 more fields. Name one “Total Score” and one “Percentage Score.” Use the merge field value finder tool again to build your expressions.
When you are done, your Update Data Fields and expressions should look like this: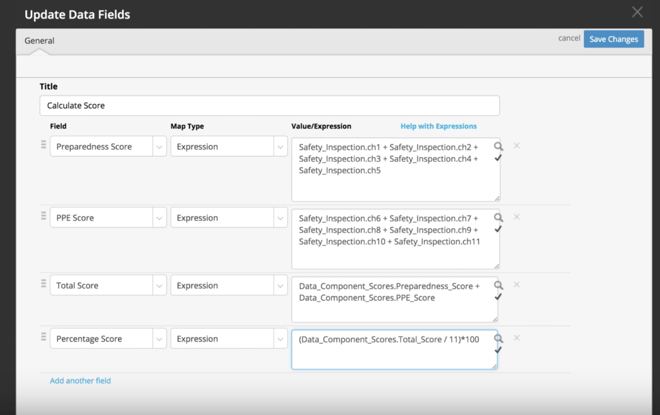
Save your changes to the Scoring step.
Back on the Stream Definition Canvas we need to connect this step to the others in the workflow. Put the Calculate Score step in between the Start Process step and the Send Report step. Drag connectors between them to connect them.
Editing report templates to add scores to them
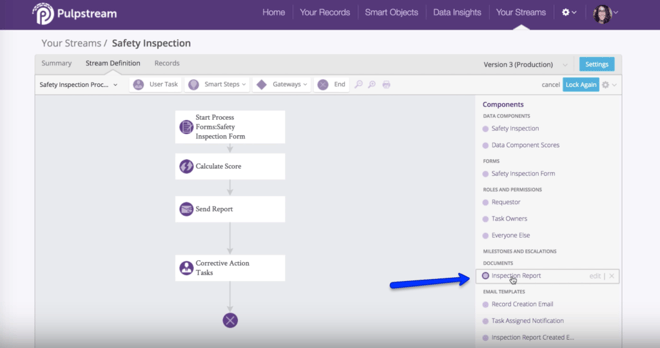
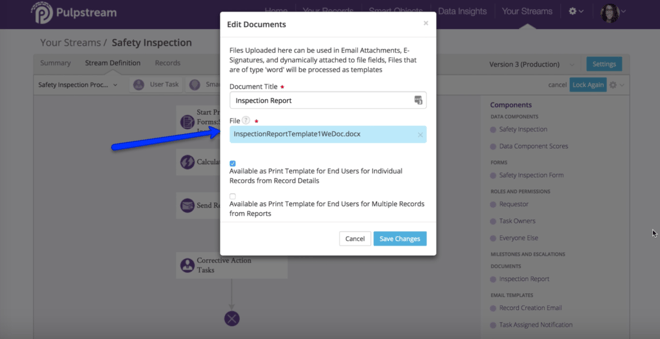
Now that we’ve created a step to calculate scores, we need to update the report template to include those. Find that template in the Documents section of your work Stream Definition canvas. On the right side of the page, under Documents, hover your mouse cursor over the Inspection Report to reveal the edit function.
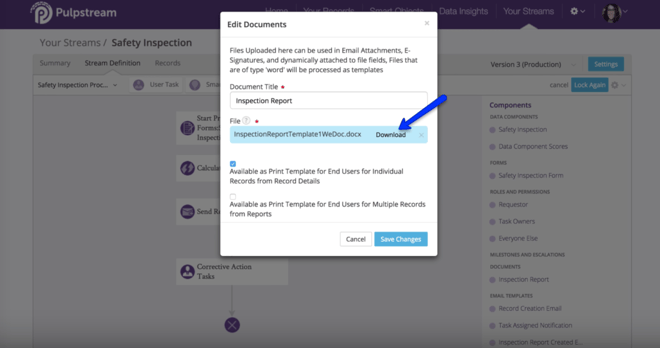
Download the Inspection Report template.
Let's familiarize ourselves with the structure of this template. Whenever you want a report to include new data points, you need to tell the Pulpstream engine which data components that information is stored in. We do that with tags.
Every section in the templates has a simple structure:
Opening tag for a data component
Field names within that data component
Field name
Closing tag for data component
Each has a << (double arrow) on the left and >> on the right. These tell the Pulpstream engine that the piece of information is a tag. The opening tags start with <<rs, while closing tags start with <<es . The rs tells the system to r estart the s ection. The e s tells the system that this is the e nd of the section. As we saw earlier, fields are what we use to store information in our data components.
S basic section in the template looks like this:
<<rs_datacomponentName>>
<<field1>>
<<field2>>
<<es_datacomponentName>>
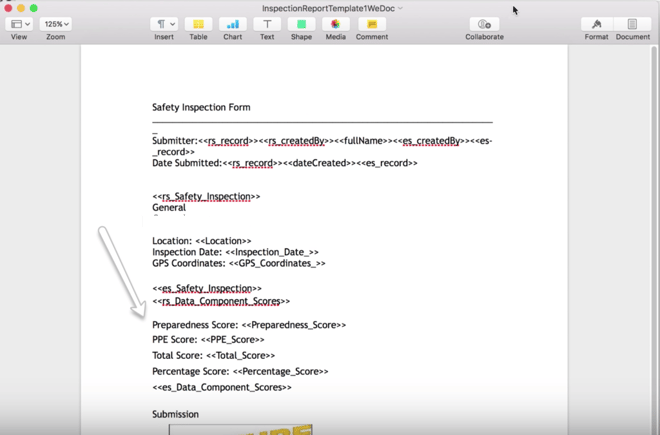
We want to add our Inspection Scores, both total and percentage, below the GPS coordinates in the report. Add the appropriate tags to make that happen. Insert <<es_Inspection>> under the GPS coordinates line. Since that breaks the flow of the section, we will need to restart the section, so that Pulpstream keeps pouring the data into the report.
Add <rs_Inspection>> above the Submission line. Add your Score tags to the report template in between the Submission and the GPS Section. Make sure your tag names match the name of the data component.
These are the names we used to create our data component:
Preparedness Score: <<Preparedness_Score>>
PPE Score: <<PPE_Score>>
Total Score: <<Total_Score>>
Percentage Score: <<Percentage_Score>>
Watch out for pluralization errors. For example, Score vs Scores. Remember to add tags to close or restart the sections. You final report template should look like this:
Testing Scoring and Report Templates
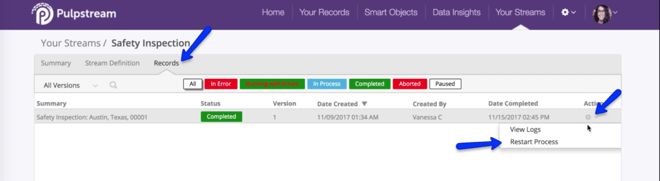
Let's test it to make sure it works. Go back to your Stream Definition canvas. Click on the Stream Records tab. Click on the gear icon to restart a record. Wait for the record to complete its processing.
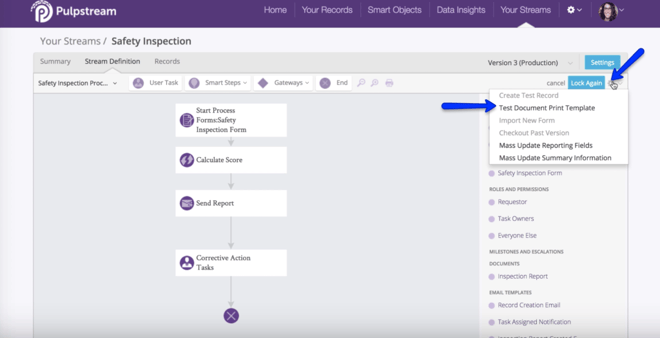
Go to the Stream Definition tab. Click on the gear icon on top right and in the pull-down menu, “Select Test Document Print Template.”
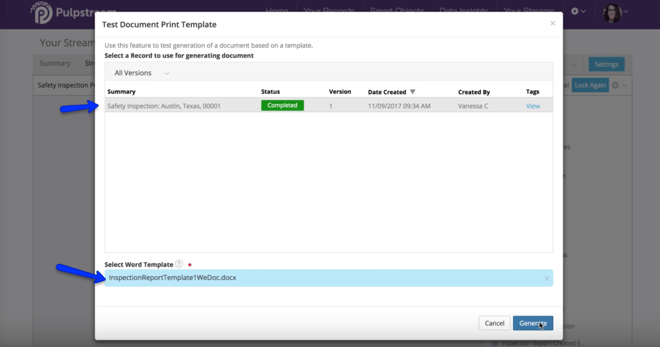
Select a record and then upload the recently-updated template.
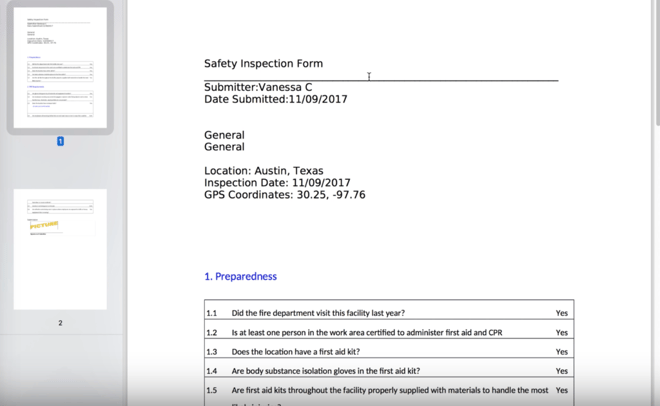
Click on the Generate button. Your browser will download a .pdf version of the generated document. It should have all the data based on the tags we typed into the template.
If it does not, here is a list of things that could have gone wrong:
The tag names in the template don’t match the ones in the data component
The section open and close tags aren’t in the right places
The bookmarks “AllQuestions” or “Signature” were accidentally deleted.
If you see the generated document still has original tags that means there is an issue in the template. You will find errors mentioned at the bottom of the generated document.
The final step is to upload the template into the Pulpstream engine. Go to your Stream Definition canvas. On the right side of the screen in your Components Catalog, hover your mouse cursor over the Inspection Report to reveal the “edit” function. Click on “edit.”
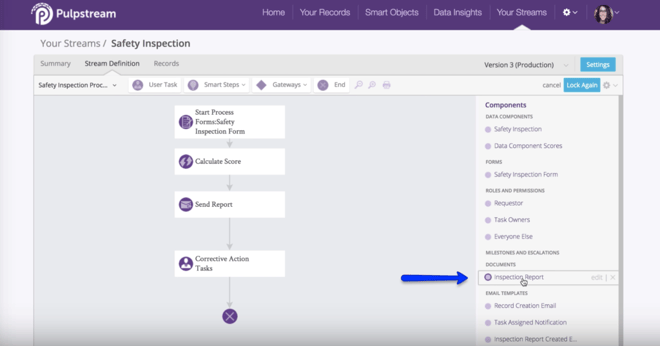
In the popup, click the X to right of the inspection report to detach the old template. Upload the one we just edited. Save your changes.
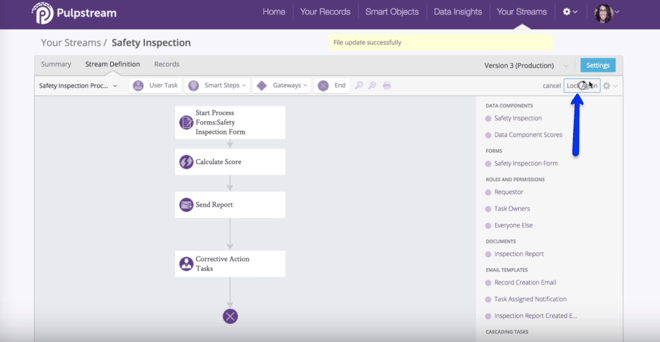
Lock that stream version.
Test it if you like. Go back to the home page and click on the Submit New Form button to go through the work stream.
At the next Skill Station we will learn how to make forms dynamic.